What does it mean to stay within a safe operating space for humanity?
That is the question at the heart of the Planetary Boundaries framework.
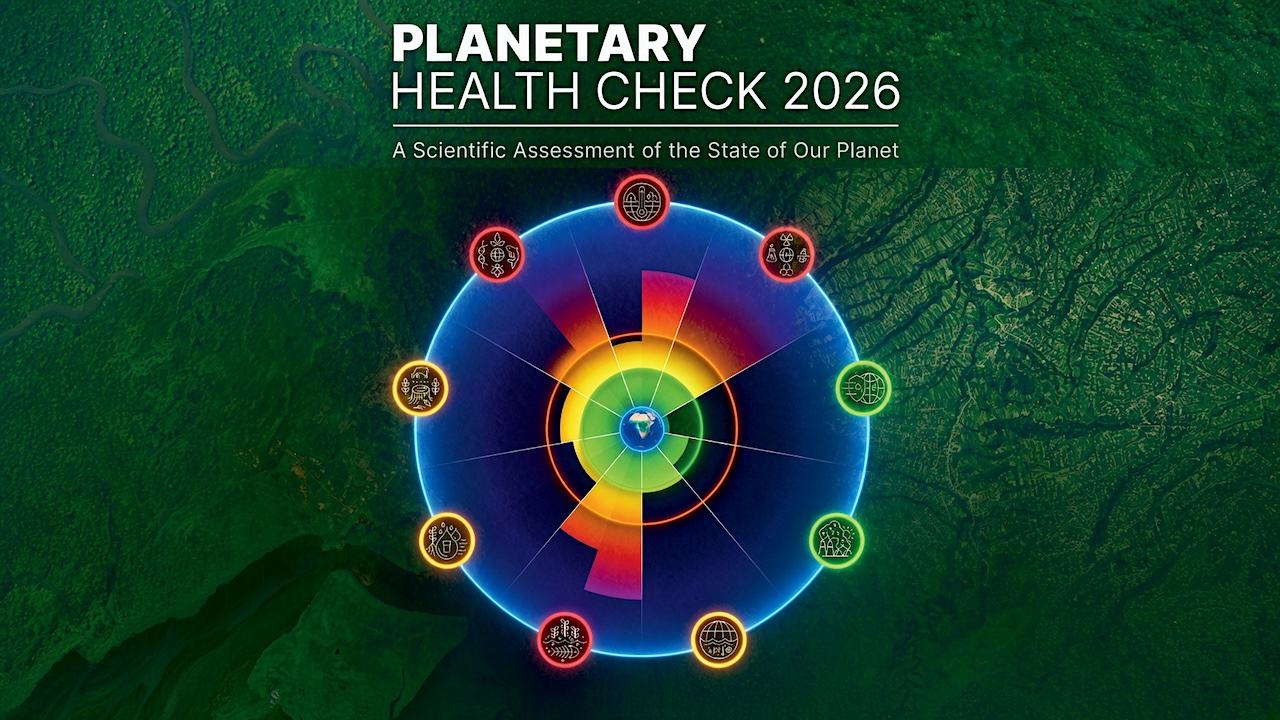
The newly published Planetary Health Check 2026 provides the latest assessment of where the Earth system stands. The report, developed by more than 60 scientists at the Planetary Boundaries Science Lab at the Potsdam Institute for Climate Impact Research, finds that seven of the nine planetary boundaries have now been transgressed, with all seven showing increasing pressure.
The numbers are important. But so is the thinking behind them.
A planetary boundary is not simply a line on a chart. It is a way of understanding the state of the systems that support life on Earth, and how far those systems are moving from the conditions in which human societies have developed.
Understanding where the boundaries are
The planetary boundaries framework identifies nine Earth system processes that regulate stability, resilience and life-support functions. Each is assessed using measurable control variables that allow scientists to track changes in the state of the planet.
The 2026 report also highlights the relationship between planetary boundaries and tipping points.
A planetary boundary is designed as a precautionary guardrail, set at a safe distance from the risks associated with crossing critical thresholds. A tipping point, meanwhile, refers to a fundamental shift in how a system behaves when destabilising feedbacks begin to dominate stabilising ones.
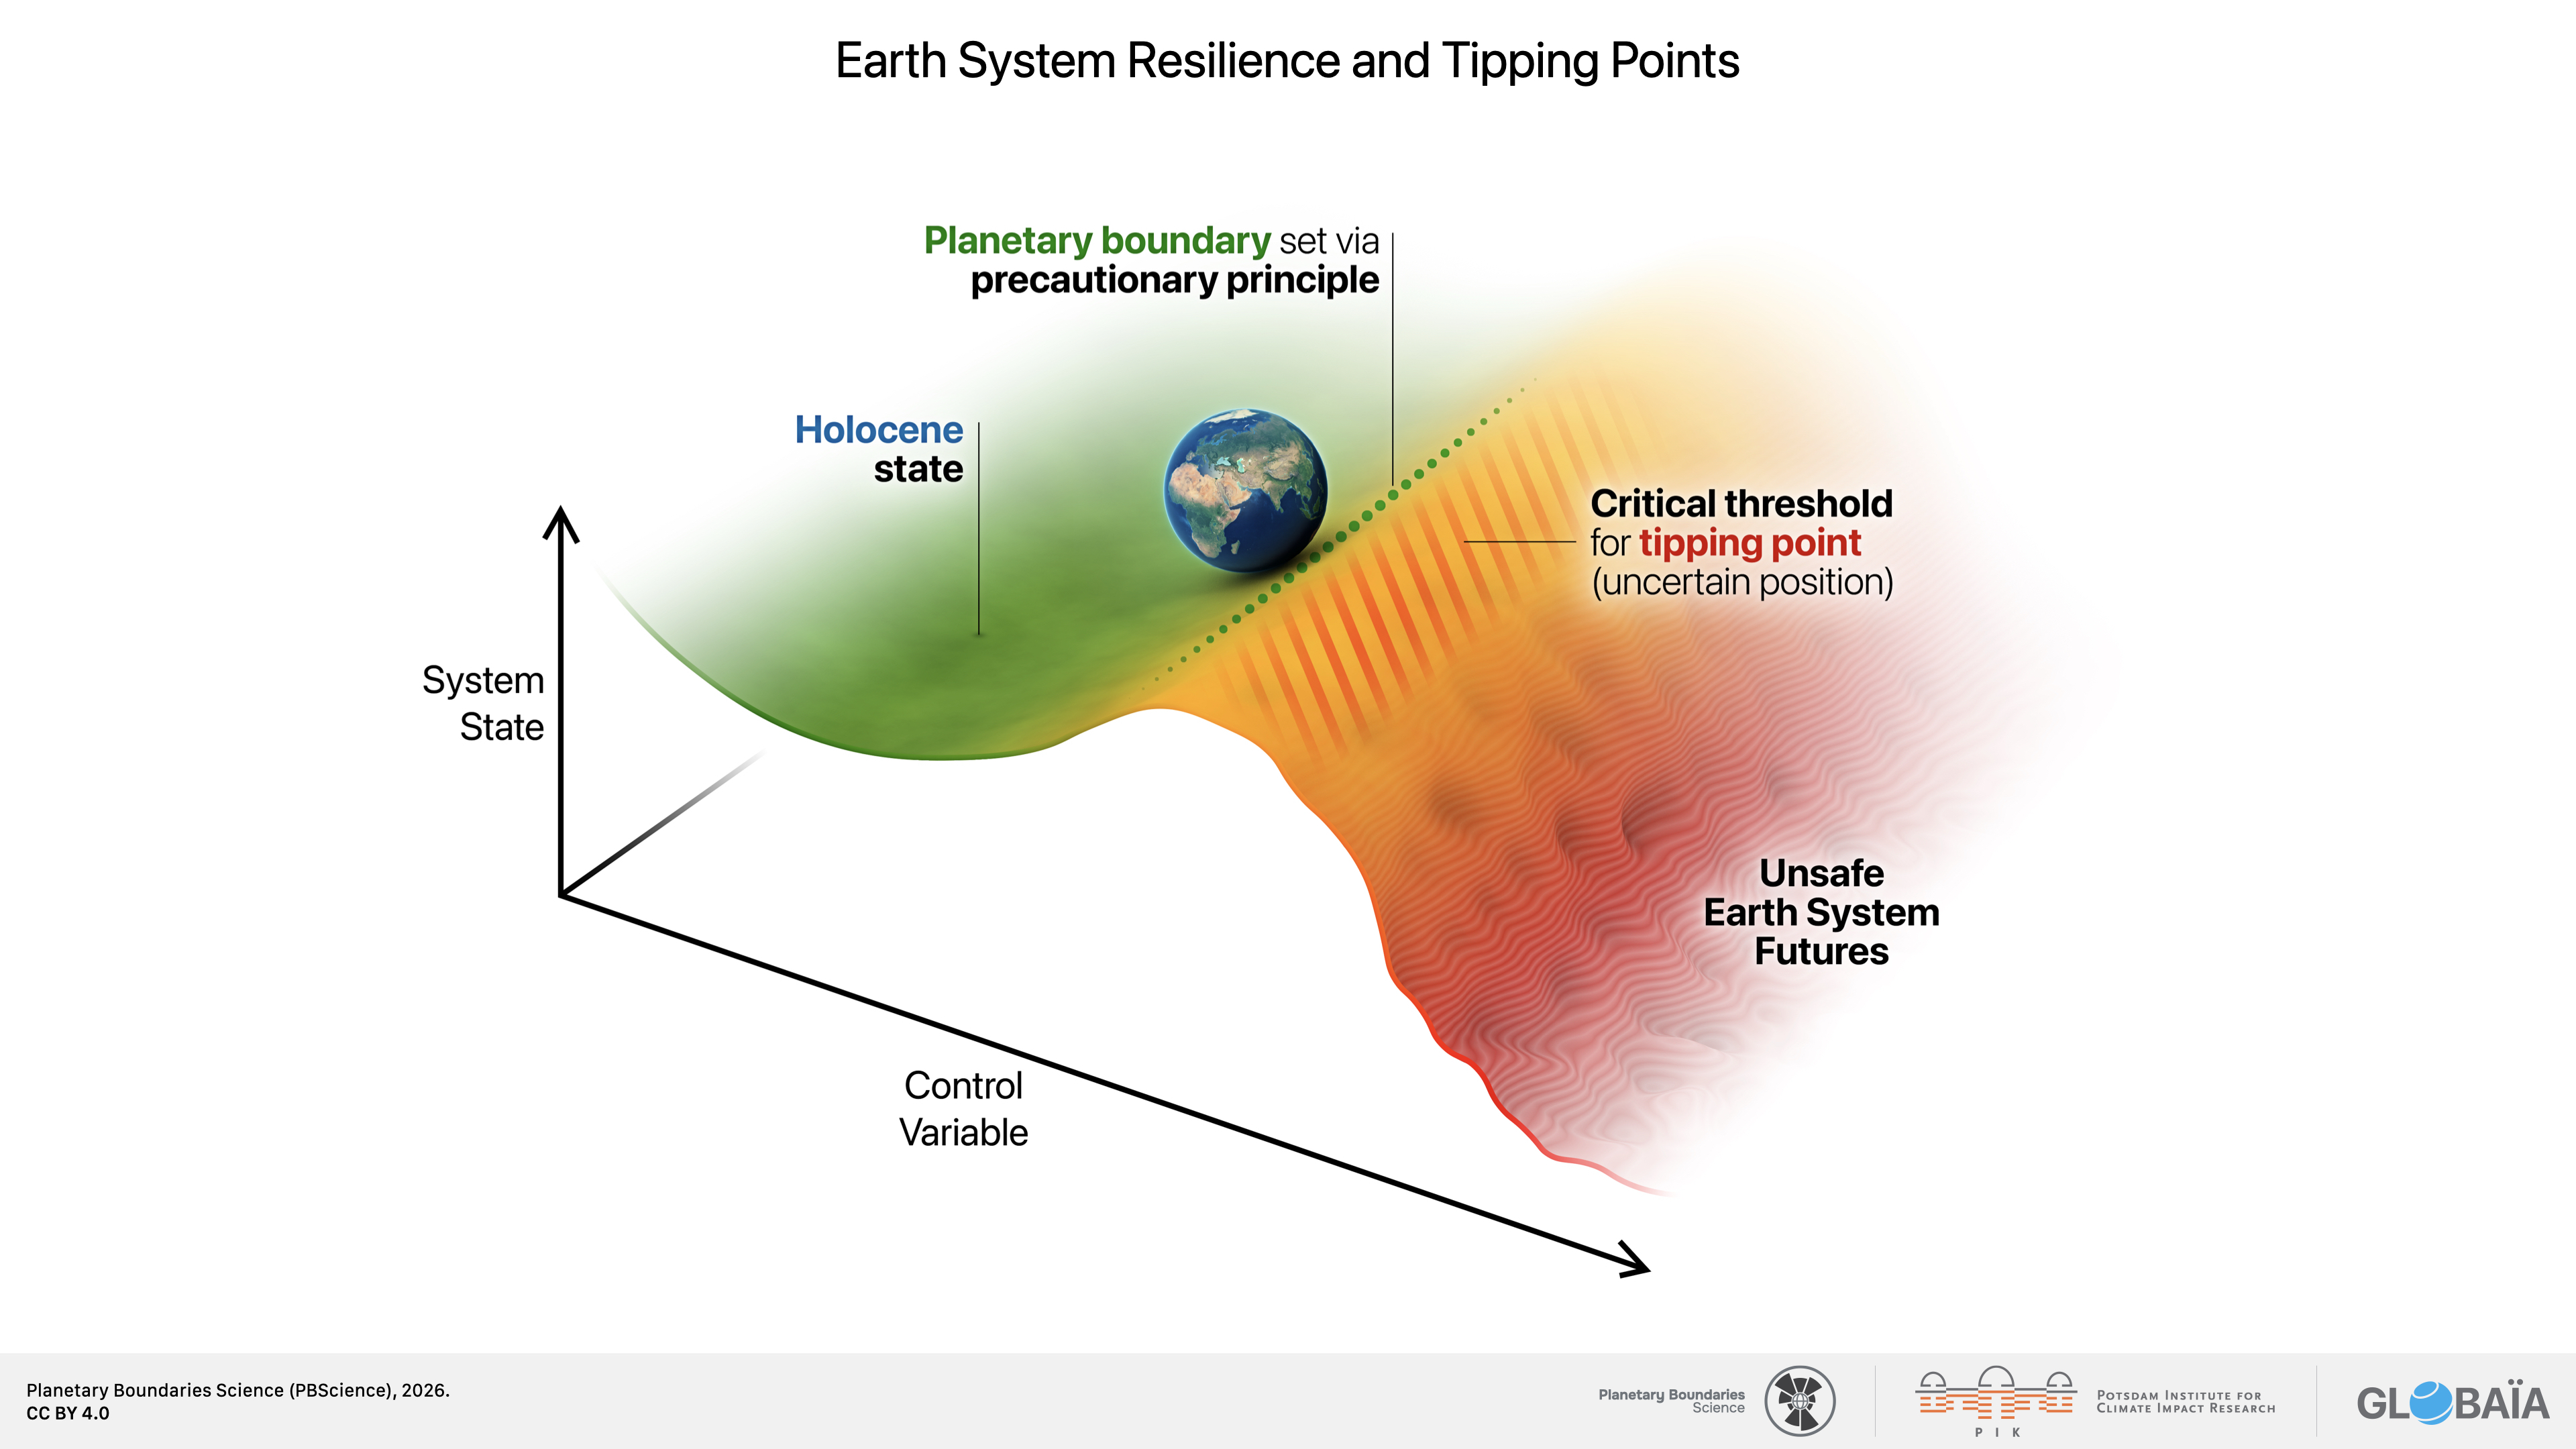
The figure is a useful reminder that environmental systems are not static.
From global boundaries to local change
The Planetary Health Check provides a global assessment. But the same principle applies much closer to the ground.
A landscape changes over time, an habitat enhancement measure is introduced, weather patterns shift due to climate change, vegetation develops, and populations respond. Some changes may happen quickly, while others become visible over several seasons.
A measurement taken once can provide a snapshot.
Measurements collected over time can reveal a trajectory to help understand whether an action is making a difference.
You cannot learn from a snapshot
Biodiversity is particularly dynamic.
Insect populations respond to seasonality, weather, vegetation, resource availability and changes in their surroundings. A survey on a single day can tell us what was observed at that particular moment. It provides much less information about what happened before or what happens afterwards.
Continuous monitoring adds that temporal dimension.
It can help establish a baseline, reveal patterns, identify changes and compare conditions before and after an intervention.
Monitoring does not automatically explain why something changed.
A change in insect activity, for example, may reflect weather, seasonality or a range of environmental factors. The value of consistent data is that it provides the evidence needed to investigate those changes rather than relying entirely on isolated observations.
What changed? When did it change? Was the change temporary or sustained? And what happened after an intervention?
Monitoring creates a feedback loop
This is where biodiversity monitoring becomes more than a reporting exercise.
A useful monitoring system creates a feedback loop:
- Measure where you are.
- Take action.
- Measure continuously.
- Learn from the result.
- Adapt.
- Repeat.
The Planetary Health Check is itself an example of this principle at a global scale. The annual assessment allows scientists to track the state of the Earth system and observe how pressures are changing over time.
At the level of individual landscapes and sites, continuous biodiversity monitoring can play a similar role.
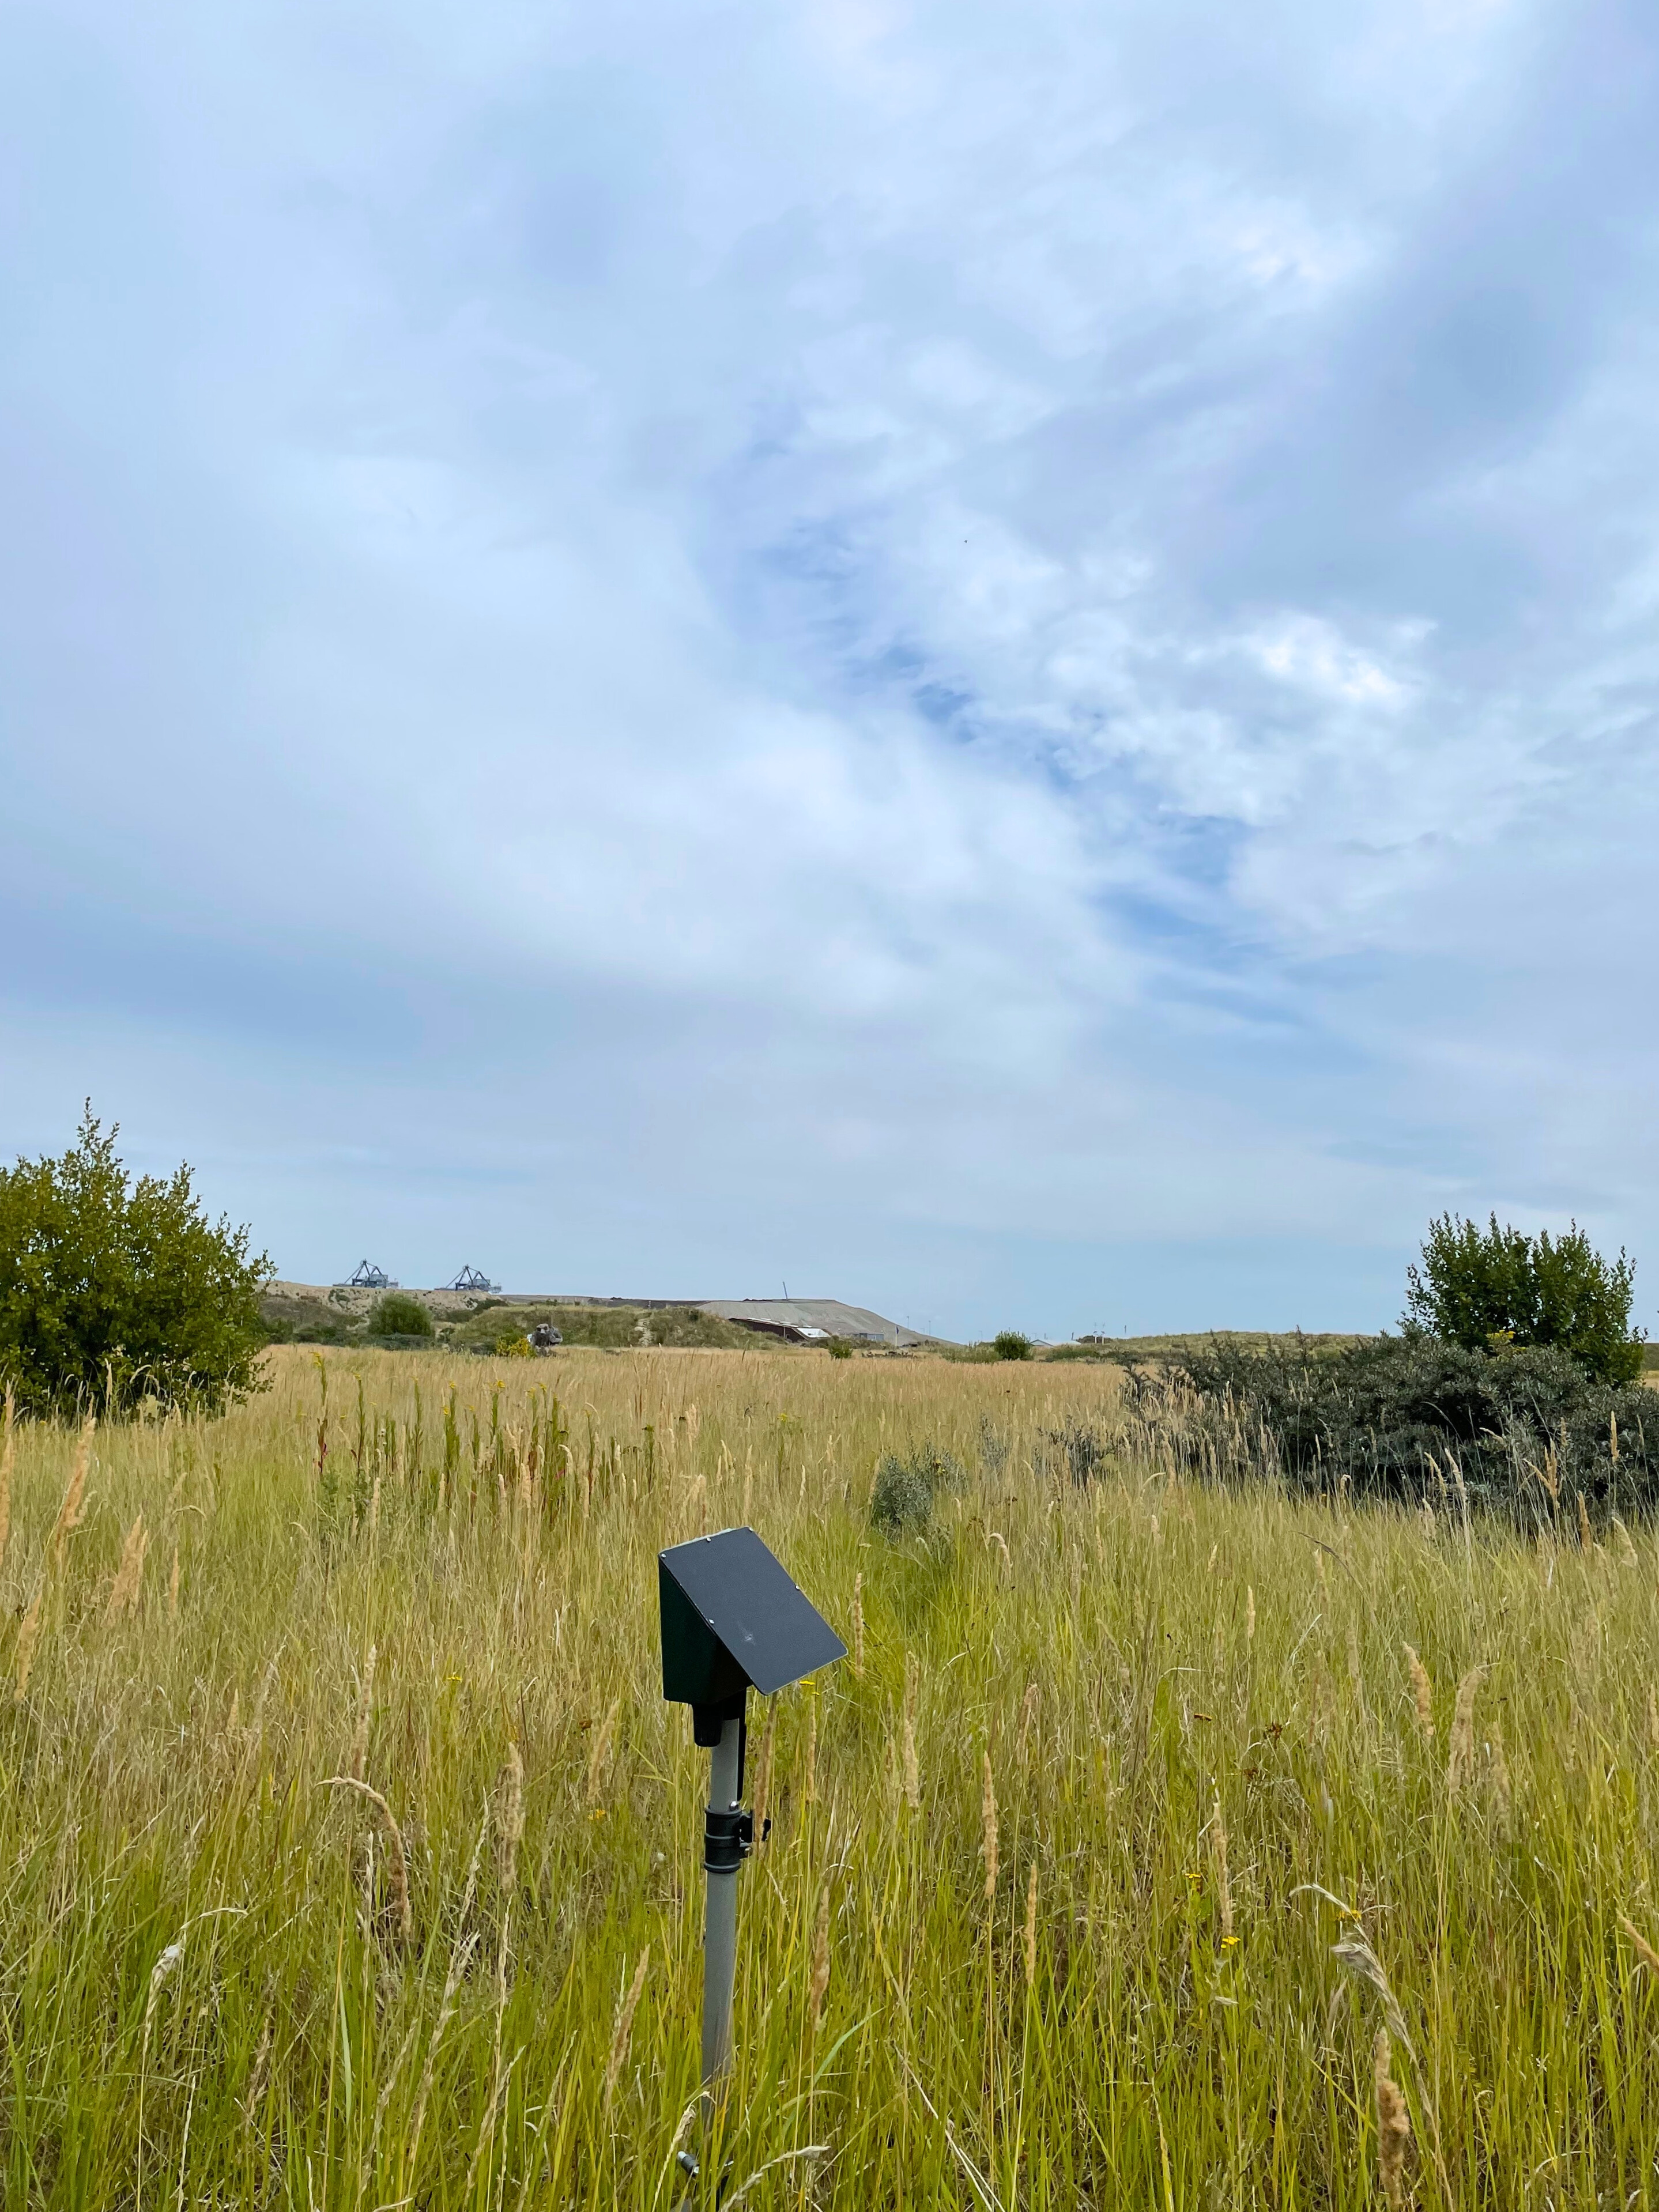
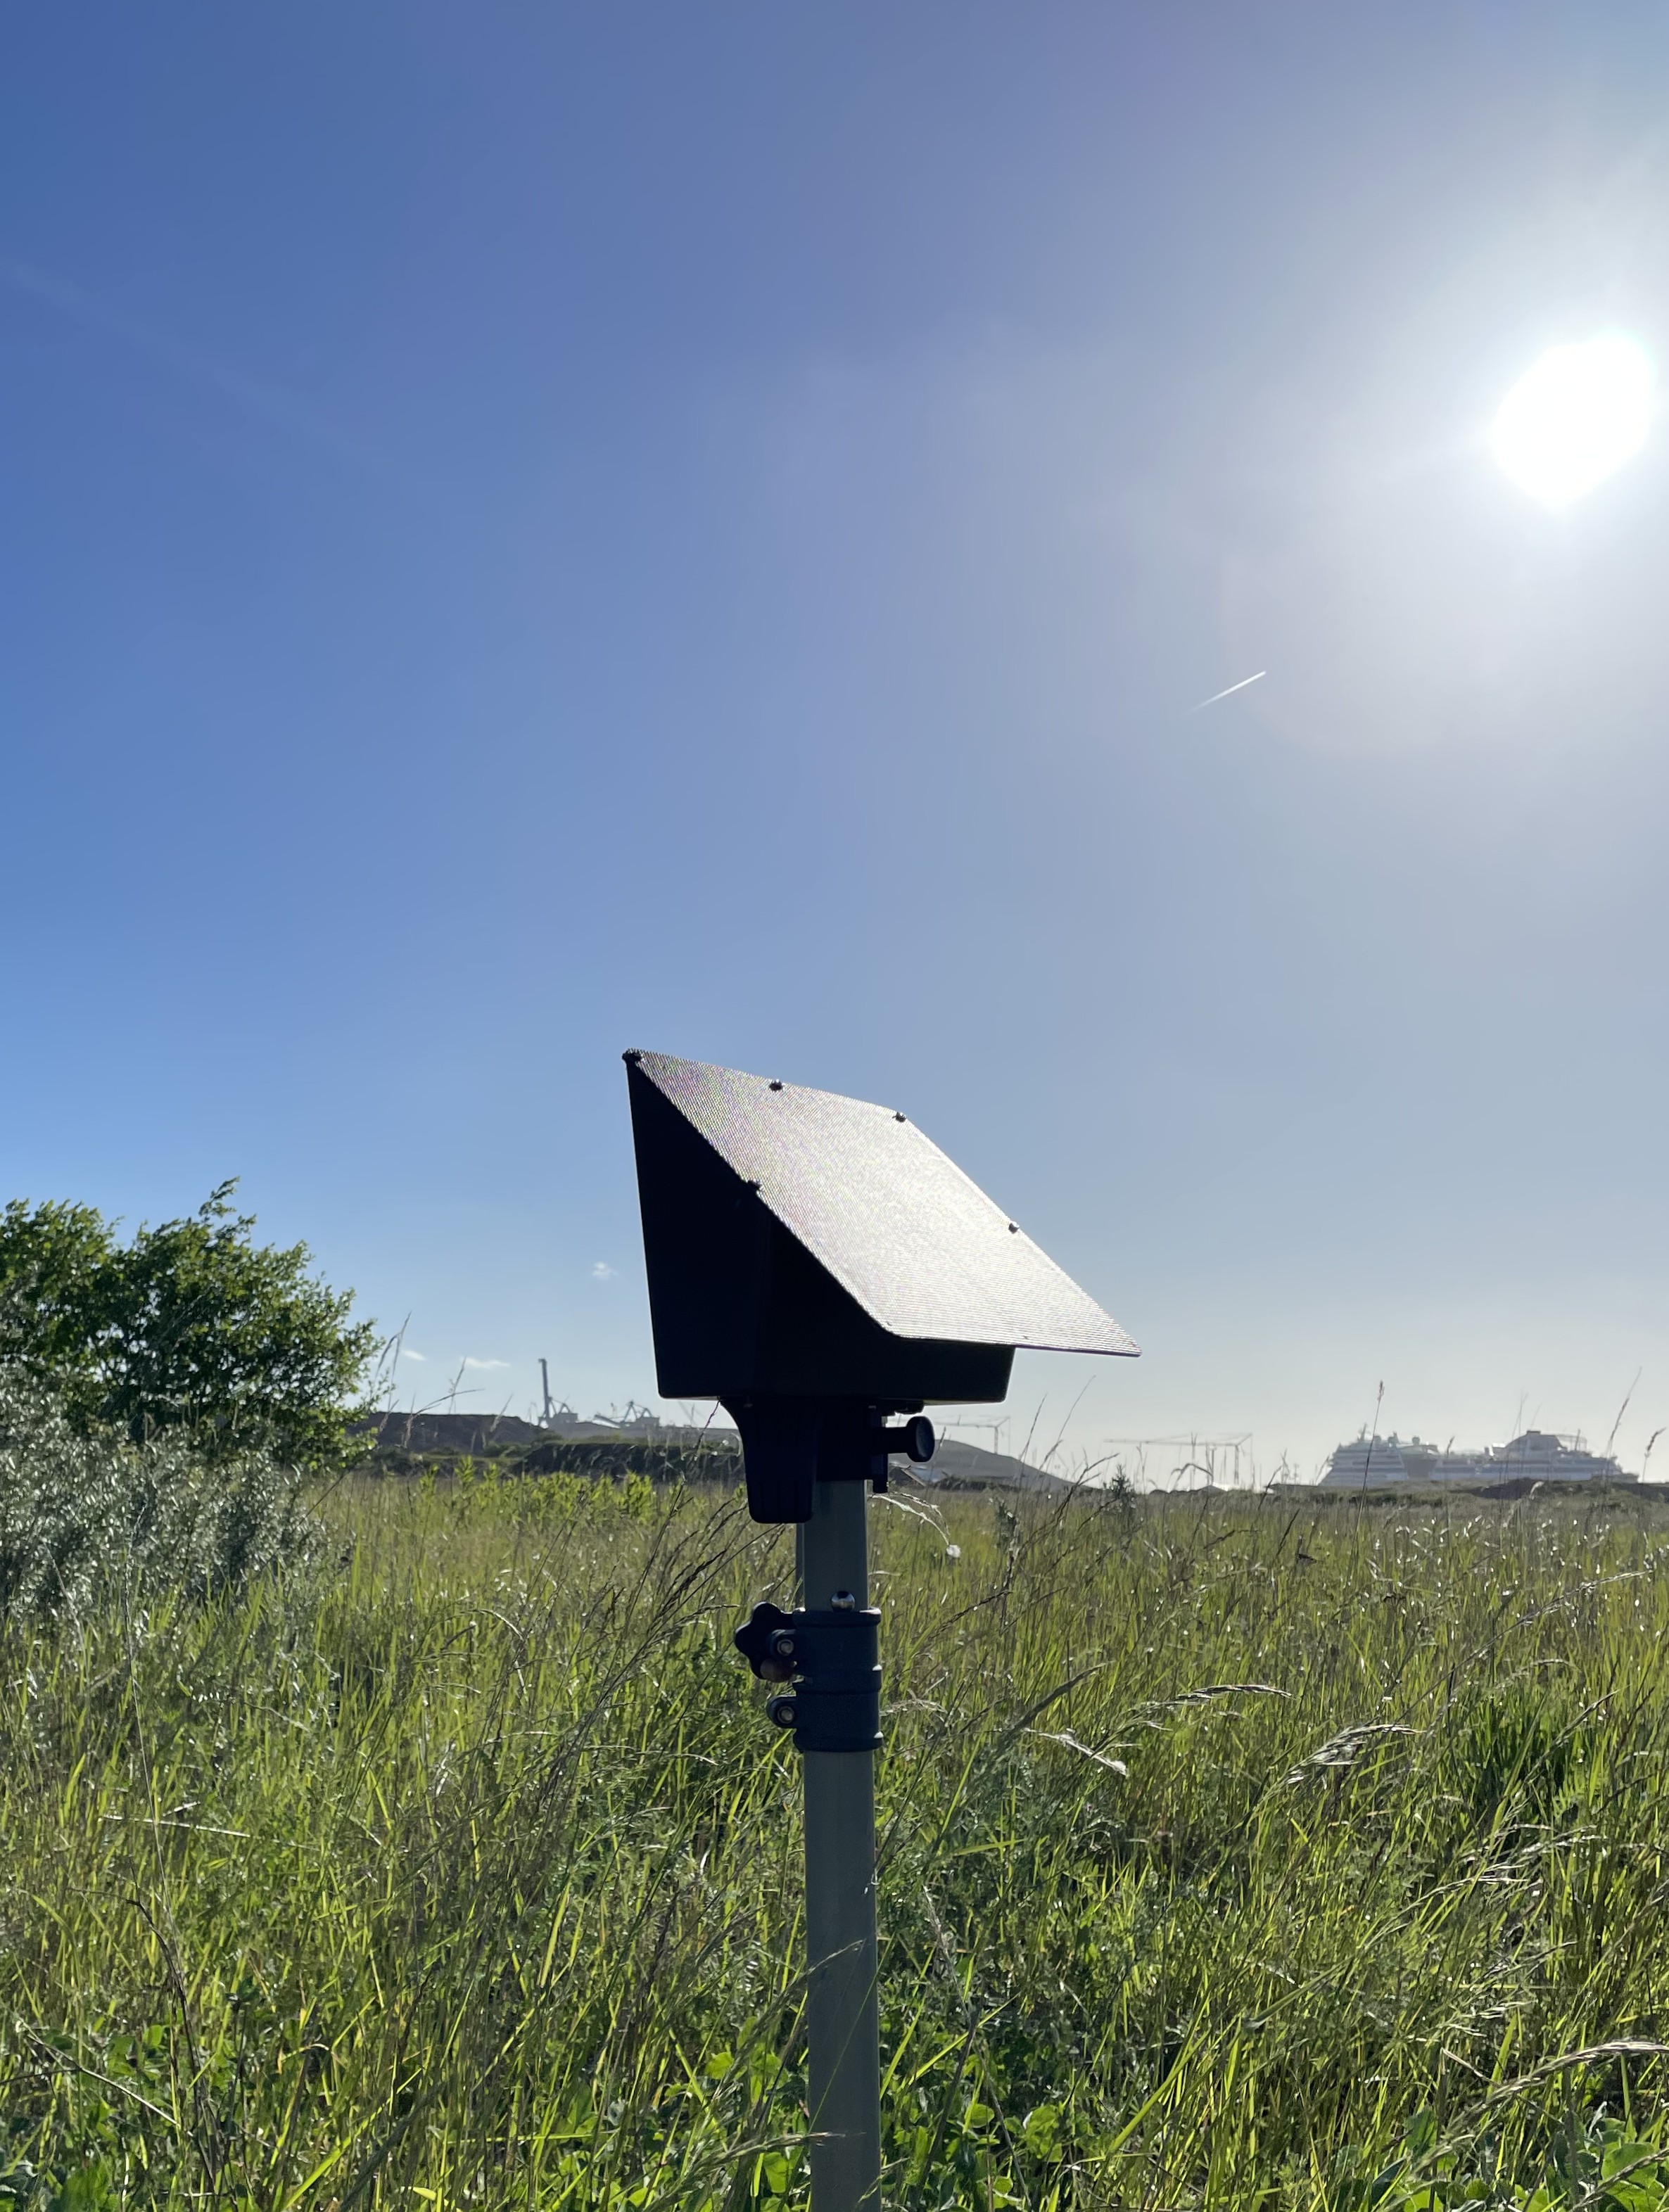
At evolito, flying insect activity is measured continuously to generate time-stamped data that can be used to observe abundance, diversity, biomass and activity over time.
The purpose is not to reduce biodiversity to a single number.
It is to make change easier to observe.
From measuring impact to learning from it
There is an important distinction between monitoring biodiversity and understanding what the data means.
Data does not automatically tell us why something changed.
But without data, we have far fewer ways to investigate the change in the first place.
This is why we believe biodiversity monitoring should be viewed as a learning tool, not only a reporting tool.
The more consistently we measure, the better we can understand patterns over time. And the better we understand those patterns, the better positioned we are to evaluate actions, refine approaches and build stronger evidence around what is happening on the ground.
The Planetary Health Check gives us a global picture of where the Earth system stands today.
The next step is to keep building the measurements that help us understand what is happening at the places where change is taking place.
Because staying on track starts with knowing where you are.

.jpg)